Showing posts with label AS Economics - Microeconomics. Show all posts

Tuesday, 12 January 2010

The theory of demand (AS-Level Economics)

What is demand?

It is desire from consumers for a particular good/service/commodity.

The demand curve...


The demand curve shows the quantity demanded by consumers at each price of a good/service.
Price and demand are inversely related i.e. as price increases the quantity demand decreases. This describes the demand curve is downward sloping.

There are two reasons one must know for why price and demand have an inverse relationship.

1. The real income effect
As the price of a good/service increases it will eat a bigger chunk of the consumers income making them feel poorer so there are only a few people who are rich enough not to feel this impact. Also, the purchasing power has decreased (and all this means is that only a few people can afford expensive goods and services as they have the financial power.)

2. The substitution effect-

This is that in our economy there is a lot of competition which keep prices low which is good for consumers. This means that there are many alternatives to the particular product you are looking for. For example if you wanted to buy window cleaning spray and saw it was £5.99 that may be relatively expensive for you so you might go into another shop and buy a different brand or similar cleaning product which will be cheaper therefore as the price of a good increases the demand decreases as consumers' will switch to alternatives.

Important key term:

Demand schedule: This is a table showing quantity demanded by consumers at each price level. This is table used to draw a demand curve.


What about shifts?

Well a shift in the demand curve will only exist if a non-price determinant changes and the quantity demanded by consumers changes at every price.


In the demand curve above we can see that the demand for shares has decreased and this can be for several reasons.

Why does the demand curve shift?

1. Tastes - social trends and fashion changes and this affects the demand for a good, For example at one point cassettes were very popular but as soon as CDs came the fashion changed to listening to CDs. The demand for cassette tapes decreased.

2. Income - If income increases then people have more purchasing power so the demand at every price level will increase. Vice versa if incomes suddenly decreased than the demand would decrease as people do not have a strong purchasing power.

3. Price of substitutes - substitutes as we mentioned before are alternatives. So if these decrease people are likely too buy more of them as their consumer surplus increases. This means that the good itself will incur a reduction in demand. For example if Pantene Pro-V hairspray became cheaper the demand for L'oreal hairspray would decrease because people would switch to the pantene Pro-V hairspray.

4.The price of complements - these are goods which complement each other i.e. go with each other. For example tea and milk. If the price of complement increases then the demand decreases. So for example if the price of milk rises then the demand for tea will decrease as people may switch tcheapero other cheaper alternative like black coffee or herbal tea,

5. Expectation of future price change - this doesn't tend to be as big as other factors. But in markets such as the housing industry or the share it has a big impact. If for example houses were supposed to increase prices in the future then the demand for houses will increase because people will wan to buy as they know they can sell it at a later date for a profit.

6. Population increase/migration- If there are more people then the demand for a product is likely to be be bigger. The two main ways in which a population can change are (i) population increase/ decrease through baby boom or increased availability of contraception and (ii) migration - this means people moving in and out of a country.

7. Distribution of income - This is by far the most interesting one. this suggest if the government increased taxes or benefits to the poor then demand for necessities will increase as that is what poor people will demand and the demand for luxuries will decrease as rich people loose some of their purchasing power for it,

Quiz:

1. Demand for a normal product may cause the demand curve to shift outwards if...
a) price increases
b) price decreases
c)the price of a substitute falls
d) the price of a substitute rises.

2.A decrease in income should:
a) Shift demand for an inferior product outwards
b) Shift demand for an inferior product inwards
c) Shift supply for an inferior product inwards
d) Shift supply for an inferior product outwards

Answers under photo...


ANSWERS!

1) D- The demand curve will only shift outwards because of non-price factors such as the price of substitutes. If the price of substitutes increases then people are more likely to switch and buy this product. For example; orange juice and apple juice are close substitutes and if the price of apple juice goes people more people will be attracted to buy orange juice.

2) A - if income decreases then the quantity demand of an inferior will increase as they have an inverse relationship. Supply is not affected by the income elasticity of a product.


Thursday, 7 January 2010

Friday, 1 January 2010

Positive and Normative Economics

As an economist it is vital to be able to distinguish between positive analysis and normative analysis.


For the exam you will be required to tell if a statement is positive or normative.


So here is how it goes...


Positive economics is facts and figures. They are statements which can be verified and tested.For example if I tell you that Burberry shares have gone up 16.2%, this is a positive statement because you can go out and test it.


So the definition for positive statements you need to know is: it is a statement that is testable or verifiable. It is a fact or assertion.
N.B - Remember in the example to give an example if you get a chance.


On the other hand, normative analysis is based on opinions - what in economics we call "value judgements". An easy way to recognise them is to look for words like 'ought' and 'should'. For example, if I say that the company Superdry should not be in the FTSE 250 then this is a normative statement because it contains the word "should" and it is my personal opinion. It cannot be tested or verified.


An example of a normative statement which does not contain should or ought is : "Some critics are calling for government intervention as rents are becoming unfairly high" - this is in fact taken from a past exam marks scheme. The reason why this is normative is because of the adjective 'unfairly' what is unfair to one person is not to another. The fact that someone can disagree with the statement is another easy way to tell the if the statement is normative.


For the exam this definition you need to know is: It is a value judgement which cannot be tested or verified.


TEST YOURSELF!


This is a great quiz to test your knowledge for the first section of economics including positive and normative analysis: 
http://wps.aw.com/aw_miller_econtoday_14/60/15392/3940402.cw/index.html


Need more help with positive and normative economics?
Check this video out below (not done by me!)


Monday, 28 December 2009

Income Elasticity of demand

Income elasticity of demand = YED


What is income elasticity of demand?


It is the responsiveness/sensitivity of demand to income.


How do economists calculate income elasticity of demand?


Income elasticity of demand = Percentage change in quantity demanded
                                                        Percentage change in income


How do you interpret income elasticity of demand values?


If YED has a negative value (i.e. less than zero)...


The good is an inferior good. Demand decreases as income increases. It is a negative correlation. For example ASDA's Smart Price notebooks.


If YED is between 0 and 1...


The good is a necessity - it is income inelastic. Demand will increase if income increases, although demand will increase by a smaller percentage than what income will increase by. For example, If income rises by 10% then demand for lets say apples will increase by less than 10%.It has a positive correlation.


If YED is greater than 1...


This good is a luxury, a normal good. Demand will increase as income increases. The good is income elastic. However this time if income increases by 10% the demand for lets say TVs will increase by more than 10%.


Want to test yourself?


Try out this quiz - beware contains other elasticities too!


http://wps.aw.com/aw_miller_econtoday_14/60/15397/3941646.cw/content/index.html


Sunday, 27 December 2009

Consumer Surplus

This is a short explanation of consumer surplus. I hope this helps make things simpler

In any given product there will be demand no matter what the price. I realise the magnitude of the demand may vary but the point is if, for example we are looking at the demand for exercise machines - whether the price is £400 or £4 there will always be someone ready to buy it (the amount of people who want to buy it will vary with the price).

We can see a similar situation in reality whether it is Primark or Harrods there is still a demand just the amount of it varies.

Now you must be wondering how does consumer surplus fit into this but it does. The market equilibrium for exercise machines may be £100 so the vast majority of supply will sell them for £100. If we imagine that all suppliers sold them for £100 then the consumers who were already ready to pay to pay over £100 will be gaining an advantage. It is almost like a profit they are making.

Subsequently, consumer surplus is defined as the value that consumers gain from consuming a good or service over and above the price paid.

We can see this clearly in a diagram:


The orange bit shows the consumer surplus - the consumers who are benefitting from the current market equilibrium price.

However, this is not all your need to know! You must know how to valuate consumer surplus. This is done through simple maths...calculating area of a triangle.

The formula for the area of a triangle is 0.5 X Base X height...

So in the diagram above the quantity OP1 is equal to the base which in this case is 100. The next bit is to identify the height and this is the difference between the market equilibrium price and the price where the demand is lowest. In this case it is the from £50 to £100 so the height is 50 (100-50).

The we multiply 50 by 100 by 0.5 and we get a consumer surplus of 2500.

That is how simple it is....

However, in exams the may frighten you by shifting the demand curve and saying what is the new consumer surplus. So remember the same principles apply you are looking at the price where there is demand is lowest and the new equilibrium price!

In economics consumers always just feel price changes.

What I have learnt when doing questions is that I miss read the questions so you have to be careful as to whether the question says what is the difference in the consumer surplus and what is the consumer surplus.

I hope this helps :)

Saturday, 26 December 2009

Friday, 18 December 2009

The Cost-Benefit Analysis Process

This is how I remember the economic calculation of cost-benfot analysis.

Firstly you examine the task been given to you so it might be that the government has limited funds and needs to decided whether it is worth investing in a project like the Olympics.

So they set two sections out - long term and short term effects. They people conducting the process must now try to think of all the possible impacts and outcomes of the Olympics and put them in a category - 'Short-term advantage' 'Short-term disadvantage' 'Long-term advantage' and 'Long- term disadvantage'.

Once this is done they must now valuate each outcome; for example if the an impact is increased tourism they must calculate exactly how much monetary value this has on the economy.

Then all the advantage values are added and divided by the sum of the disadvantage values.

The number given will firstly show whether the project involved will make a profit or a loss (indicated by the sign of the value (e.g. -60 or +60). The size of the value can be compared to the sizeof the values from other projects and the larger (and positive) the value the more economically fruitful it will be. That is the project you must choose.

So why exactly is this important?

Well if we never weighed up and made decision the government would be making some potentially terrible decisions. The government has limited funds and can't increase them very easily so for example increasing taxes would create a big controversy. If they made bad decisions then slowly they would see they are running out of revenue and would not be able to function any more.

A good example which is very closely related to us can be seen on youtube: http://www.youtube.com/watch?v=Rh7ygXiR_rs&feature=fvw

Although there are many flaws with this system:

  1. Firstly it is difficult to put a value on non-monetary effects particularly when they are to do with the future (long-term) e.g. increased pollution in the future.
  2. Very lengthy process - it is opportunity cost for the people completing the process.
  3. A lot of the time externalities are missed out and how would you put a value on that?
  4. If you were to put tax how would you know whether that was an advantage or disadvantage; who will be prioritised more the rich or the poor?

Friday, 11 December 2009

Subsidies (AS Level Economics)

  • A subsidy is opposite to a tax. It is money given by the government to encourage the consumption and production of certain goods.
  • This works something like this : (i) Producers are given money to help them cover costs -> (ii) Costs decrease for producers -> (iii) This increases supply of the good -> (iv) This will decrease the price of the good ->(v) This will increase demand/consumption of the good.
  • Subsidies can also be given to stabilise price, cut down domestic costs of production so that imports are reduced.
A subsidy diagram:


(Diagram produced by Komilla Chadha)
Click on the diagram to enlarge it!

So this diagram shows a subsidy.
  1. It shows that price has decreased
  2. It shows the quantity has increased
  3. The red arrow shows the subsidy per unit
  4. To get the full subsidy given by the government we multiply subsidy per unit by quantity so the blue rectangle [p1p2(purple dot)(point vertically above purple dot)] is the total subsidy in this image.
  5. The orange square within the total cost of the subsidy is what amount of the subsidy the producer keeps.
  6. The yellow part of the subsidy is what effect the subsidy has had on consumers.
  7. The amount producers and consumers feel all depend on the elasticity of the good.
This is video by an amazing economics teacher explaining subsidies:

Sunday, 6 December 2009

Price Elasticity of Demand (AS-level)

Price elasticity of demand = PED

What is price elasticity of demand?
It is the responsiveness/sensitivity of demand to a change in price.

How do economists calculate price elasticity of demand?

PED = % Change in Quantity Demanded
-----------------------------------------
% Change in Price

How do we interpret price elasticity of demand values?

Price elasticity of demand values are always negative because the show that price and demand have an inverse relationship.

If PED is < -1 :

If PED is smaller than minus one then this implies that the demand is elastic. For example, if the price of a good rose by 10% the quantity demanded would decrease by more than 10%. Airline tickets are a good example because they are elastic.

If PED is between 0 and -1 :

This means that the demand is inelastic. For example if the price of a good increased by 10% then the quantity demand would decrease by less then 10%. A good example of this is food as they have relatively inelastic demand.

If PED = -1 :

Then this means the demand is unitary elastic. This is the rarest out of all the elasticities. It means that if a price of the good rises by 10% the quantity demanded will decrease by 10%


To understand the graphical representation of PED please click here.

Test yourself (Answers found at the bottom)

1. If price increases from 10 to 12 pence and the price elasticity of demand is -0.5. The quantity demanded was 500 units. What will it be now?

a) 550 units
b) 500 units
c) 450 units
d) 490 units

2.If price elasticity of demand is unit then a fall in price:

a) Reduces revenues
b) Increases revenues
c)Leaves revenues unchanged
d) Reduces costs

ANSWERS!

1. c) This means that any given percentage fall in price leads to an increase in quantity demanded that is half as much; a 20% price increase will reduce the quantity demanded by 10%. This means the quantity demanded will be 450 units.

2. c) This means the percentage change in quantity demanded equals the percentage change in price so price changes will not alter the revenue.

A great video to help you with this: http://www.youtube.com/watch?v=4oj_lnj6pXA&feature=related


Also why not check out some further notes in pdf style (not I have not created this file) : http://www.osc-ib.com/ib-revision-guides/pdf/economics-hl-1.pdf


Wednesday, 25 November 2009

Cross Price Elasticity of Demand (AS-Level economics)

What is cross price elasticity of demand (XED)?

Cross price elasticity of demand is the figure which denotes the relationship between two goods.

How do economists calculate Cross price elasticity of demand?

XED = Percentage change in quantity demanded of good A / percentage change in the price of good B

Percentage change in quantity demanded of good A (divided by) percentage change in the price of good B

How do we interpret cross price elasticity of demand values?
Negative value = complements
If the value is greater than -1 than they are strong complements and if they are less than -1 they are weak complements.

'0' (zero) value = independent goods (they have no value)

Positive value = substitutes
If the value is greater than 1 then they are strong substitutes and if they are smaller than 1 they are weak substitutes

TEST YOURSELF! (Answers found below)

Q1: What type of relationship is there between two goods, X and Y, given that:
- Original price of good X =80
- Original quantity of good Y = 50
- Final price of good Y=40
- Final quantity of good Y = 40
- Original price of good Y = 5

Q2: For each of the following product pairs what would you guess about the cross price elasticity of demand? What are their relationships? Do they have a strong or weak relationship?

a) Shoes and sneakers
b) Gasoline and sports utility vehicles
c) Bread and butter
d)Instand camera film and regular camera film

ANSWERS!

Q1: XED = % change in QD of good Y / % change in P of good X

= [(40-50)/50] * 100 / [(80-40)/80] * 100
= (-10/50 ) * 100 / (-40/80) * 100
= -0.2 * 1o0 / -0.5 * 100
= -20/-50
= +0.4

Therefore they are weak substitutes

Q2: (a) Weak substitues - positive value for XED which is less than 1
(b) Strong complements - negative value for XED which is greater than -1
(c) Strong complements - negative value for XED which is greater than -1
(d) Strong substitues - positive value for XED which is greater than 1

Tuesday, 24 November 2009

Production Possibility Frontiers (PPFs)

What is a PPF?

A PPF is an economic model which shows all the maximum possibilities of two goods that an economy can produce.


Why is the frontier downward sloping?

That as you go further on the frontier you will incur more opportunity cost, which is benefits foregone from the next best opportunity.

How can we calculate oppurtunity cost?

Total given up / total gained
(total given up divided by total gained)

What happens when the frontier is a straight line?

This tells us that the opportunity cost at every point is the same whereas on a curve we see that the opputunoity cost changes as you travel across the curve.

Why the frontier normally bowed outwards?

This is do with the increasing oppurtunity cost. The further you travel on the curve the bigger oppurtunity one has.

Explain why (a) points can be inside of the PPF? (b) points can be outside the PPF?

(a) This can be if resoures are not used to the their optimal level. For example labour is a resource and if unemployment is there then what happens is that the resources are not being used to maximum potential so the economy is working at a point below the optimal level which is depicted on the curve.

(b) This is not possible. It is not possible for an economy to operate at a level outside of the curve because the curve show the maximum points so outside it would be impossible. However, if resources are increased then the curve shifts.

Why does the frontier (a) shift right? (b) shift left?

(a) The frontier as we mentioned before can shift to the right if resources are increased. If resources are increased then there will be a new maximum level as more can be produced therefore the curve shifts right.


(b) The frontier can shif tothe left hand side. If resources can be increased then they can also be decresed too. For example, if a natural disaster takes place then the amount of resources will decreases and this means that optimal levels will decrease too so the curve is shifted inward.

How does resources such as; (a) land (b) labour (c) capital (d)technology increase in order to shift the frontier outward?

(a) Land can be increased in many ways e.g. if brownfield sites are generified, if other countries are invaded or new land like mountains are formed.

(b) Labour can be increased in several ways too e.g. if immigration increases, training/education increases or in the long-term a baby-boom will cause labour increase.

(c) Capital can increase too. Capital goods are things like machinery which in the long term help increase productivity. So investment in new capital, technological advances and automation will lead to this. It is important to recognise that consumer goods will provide short-term wealth to the economy but capital goods will bring long-term wealth.

(d) Technologicl advancement are similar. However, these include factors like if medical equipment is advanced than it will increase labour as people will be more healthy or if a new type of fast transport is invented then it will enable people to get to work faster - increasing output.

Explain how a PPF would be used in the real world?

In the real world PPFs are used with axes being 'consumer goods' and 'capital goods' as an economy can only make these two types of goods (this is a simplistic view). Analyst would see that if we should or shouldn't, and if we should then by how much we should invest in capital goods as this will in the long-term increase the output of the country. If for example an economy has just incurred a natural disaster then they would have focus more on consumer goods as demand for them would be higher and they need short-term goods like blankets not long-term capital.

Does the PPF have any disadvantages?

The PPF being an economic model is based on assumption and ceteris paribus. There are three assumptions being made with a PPF and these are:

1. We assume that in an economy there is only two types of goods.
2. That the units measuring one axis are the same units on the other axis. For example if our axis had food and clothes then we are assuming that both are measured in tonnes.
3. We have to also assume that it is over a fixed time period such as a year.

Also, I mentioned above it is based on ceteris paribus, which is all things being kept at a constant. For example if we look at our clothes and food PPF again we will have to take in account that subsidies, taxes etc. are all kept the same so the PPF does not affect it.

Tuesday, 17 November 2009

Market Failure: Public, Merit and Demerit goods (AS-Level)

Market Failure: Public, merit and demerit goods (AS-Level Economics)

Some goods are not at all provided by the private sector because there is no incentive to do so. These goods are called public goods and they are generally goods which ‘good’ for you. For example the ‘fire brigade’.
Public goods are distinguished by three key characteristics:

1. Non-rivalrous/ non-diminishable: This means that the consumption by one person will not reduce the amount for another for example, if someone watches a firework display then this does not reduce the ‘benefits’- enjoyment that others can receive from it.

2. Non-excludable: people cannot be excluded from benefiting in the good in any way for example everyone can receive benefit from street lighting, people who cannot afford it are not excluded.

3. Non-rejectable: for example just because you do not want to be protected the national defence does not mean you can have the choice to do so, it is good which you have to accept.

Some goods only have one characteristic and therefore fit in a completely different category. These goods are called ‘quasi-public goods’. An example of this would be the beach because it may be designed to be non-rivalrous, non-excludable and non- rejectable but this is not the case in reality. It usually is but if there are too many people then your benefit gained from consuming the good may be reduced. Also, not all beaches are 100% non-excludable because some beaches restrict smoking or people with dogs or even better some beaches are private.

Merit goods

These are goods, which are good for you but tend to be under-consumed because they are supplied through the private sector and there tends to be an information failure as well. It is usually because people aren’t aware of the benefits so the demand isn’t as high as it should be. These goods also cause positive externalities. For example, schools can be private and state-run. However, it is important that government has stepped in to produce state-run schools because otherwise many people would not go to school and this would have cause things like increased crime. Therefore, a merit goods like schools cause positive externalities i.e. going to school reduces crime.

Demerit goods

These are the opposite to merit goods; these are goods which are bad for you e.g. alcohol and cigarettes. If left to the free-market economy, then as the demand for these products tends to be inelastic, prices would be too low to compensate for the externalities produced and the quantity would be too high. Subsequently, the goods are overproduced. That’s why the government must intervene to cut the production and inform peoples of the negative impacts. Some goods have such major negative impacts that they have to be banned for example; illegal drugs like heroin.

This is linked into market-failure because of the free-rider problem. Firstly, negative externalities hold a big cost to society that’s why they can cause a market to fail i.e. if left to free-market everyone would be smoking cigarette which would stress the NHS and people would be spending their income on the wrong things. With merit goods, people would not pay for certain advantages they gain through activities of others and so they get a free ride. This mean there is no incentive of profits for the private sector and if no one provides for these goods like (e.g. street lighting) then the market fails.

Still need help then why not check my video out:

Thursday, 12 November 2009

Theory of supply (A level economics)

What is the theory of supply?
At higher prices, a larger quantity will generally be supplied than at lower prices, ceteris paribus (all other thing being constant). So at a lower price a smaller quantity is produced.

This simply describes the upward sloping supply curve. The curve denotes that there is a ‘positive’ or ‘direct’ relationship between price and quantity. As one factor increases so does the other.

But why does this happen?


Suppliers have the incentive of profits, if a crop is doing well they will try and shift supply up so that they can make more profits.
The law of increasing opportunity costs means that as you increases supply of one good you must sacrifice greater and greater amounts of other resources. Therefore, as output increases , costs of producing goods increases thus the supplier must charge higher prices.

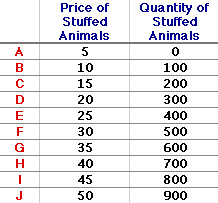
The supply curve

A supply schedule is simply a table of data showing the quantity that suppliers plan to supply at each level e.g.


A supply curve is a line which shows the quantity that suppliers plan to supply at each level e.g.:


Notice that as price increases the level of supply increases. (Positive correlation)


Shifts

The supply can shift left of right if there is a change in the quantity that supplier would supply at every price.


For example in this diagram we can see that the supply shifts to the right which is an increase in supply.
At price of P1, we can see supply increase (Sorry not that clear on this particular diagram) Notice a shift in the opposite direction from S1 to S0 would be a decrease in supply.


What causes these shifts to occur?

A shift in supply is caused by non-price determinants. There are 5 main ones you need to know:

1. Changes in costs of production: The lower the costs the greater the profit for producers. Examples of this are; input prices (raw material, rent etc.) , changes in technology (e.g. internet) , organisational changes , subsidies and taxes.

2. Profitability of alternatives; if another good becomes more profitable then a firm will switch t produce more of that e.g. the transition between cd players to MP3 players.

3. Profitability of goods in joint supply; If the supply of one good e.g. cattle increases then so will the joint good e.g.leather

4. Random shocks e.g. strikes, weather, wars, earthquakes etc.

5. Expectations of future price changes; for example if a firm expects price to rise they will either produce more or hold onto stock.

IMPORTANT:
NON-PRICE DETERMINANTS CAUSES SHIFTS AND PRICE DETERMINANTS CAUSES MOVEMENTS ALONG SUPPLY CURVE.


Need more help...check my video out!

Sunday, 18 October 2009

The basic economic problem

Transcript for video and general notes
AS Economics (Edexcel)


The basic economic problem is the problem that in the real world there are scare resources, that is limited quantities of resources and unlimited wants of these resources. Economists have to be able to make distinction between a want or a need in order to see whether they are limited or unlimited. Needs is something humans need for survival e.g. food. Wants are something, which are not needed for survival e.g. an iPod.
Resources have to be allocated which means choices have to made. The basic economic problems means that societies need to decide:
- What to produce
- How to produce it, and
- For whom to produce it
Every time we make a choice we fail to choose another option and the benefit lost from the next best opportunity is called opportunity cost. For example, right now you have chosen to watch this video your opportunity cost might be talking to your friend on the phone.
There are four factors of production that bring some form of output to the world. These are:
1. Land- includes premises and all natural resources e.g. timber, farming
2. Labour – workers and human resources
3. Capital – all manufactured resources e.g. machines, vehicle, building tools
4. Entrepreneurship – Involves risk taking, setting up a new business etc.
Out of production we get to two types of goods: economic goods and free goods. Economic goods are goods that are made from resources, which are scarce like oil. So free goods are goods made from resources, which are not scare like air.
Sustainable resources are those, which can be exploited over and over again because they can renew themselves e.g. sunflowers. In contrast, resources such as coal and oil cannot be replaced therefore are not sustainable.